Whorlmap Paper
Analysis and figures for a technical paper documenting the design and application of whorlmap.
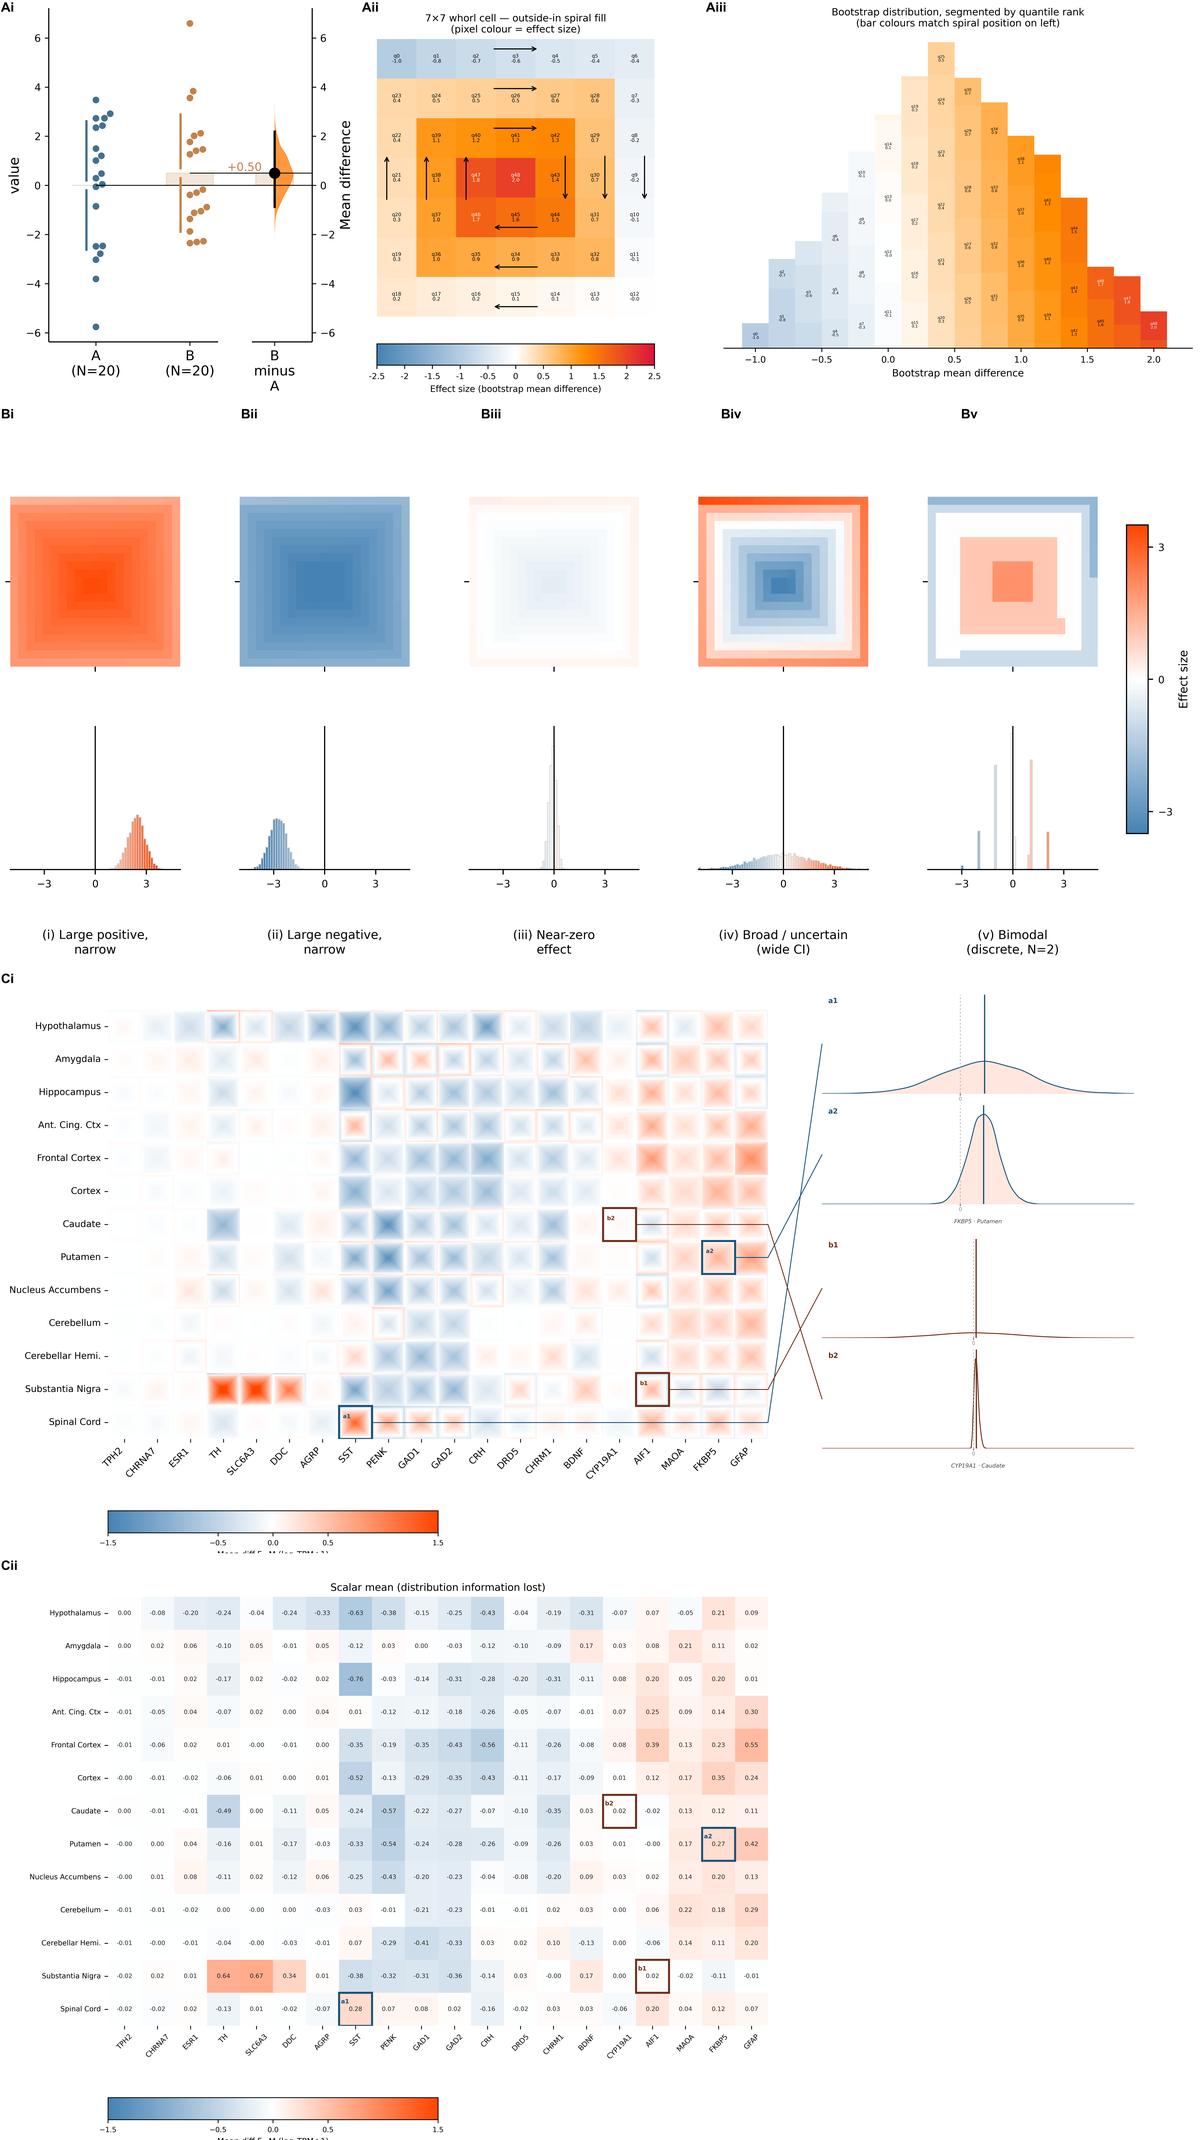
Whorlmap is a compact heatmap design for high-dimensional comparisons where each cell encodes a full bootstrap/effect-size distribution as a tiny spiral, rather than collapsing uncertainty into a single color. It lets readers scan many treatment–outcome contrasts at once while still seeing direction, magnitude, and uncertainty inside each cell.
Notebooks
| Notebook | Description |
|---|---|
| Figure 1 | GTEx sex-difference analysis across 13 brain regions × 20 genes — the main paper figure |
| Data Pipeline | GTEx v8 download, stream-parse, and metadata generation |
| Cache Builder | Slice full GTEx to the 20 display genes → committed 514 KB cache |
Reproduce Figure 1
git clone https://github.com/sangyu/whorlmap-paper
cd whorlmap-paper/nbs
pip install dabest pandas numpy matplotlib seaborn scipy Pillow svgutils lxml nbconvert ipykernel
jupyter notebook figure1.ipynb
figure1.ipynb loads the committed expression cache and runs dabest.combine() live. Bootstraps, whorlmap, and all panels are generated fresh. Runtime ~10–15 min.
Data
Gene expression data are from GTEx v8:
GTEx Consortium. The GTEx Consortium atlas of genetic regulatory effects across human tissues. Science 369, 1318–1330 (2020). https://doi.org/10.1126/science.aaz1776