Cohort shifts by phase
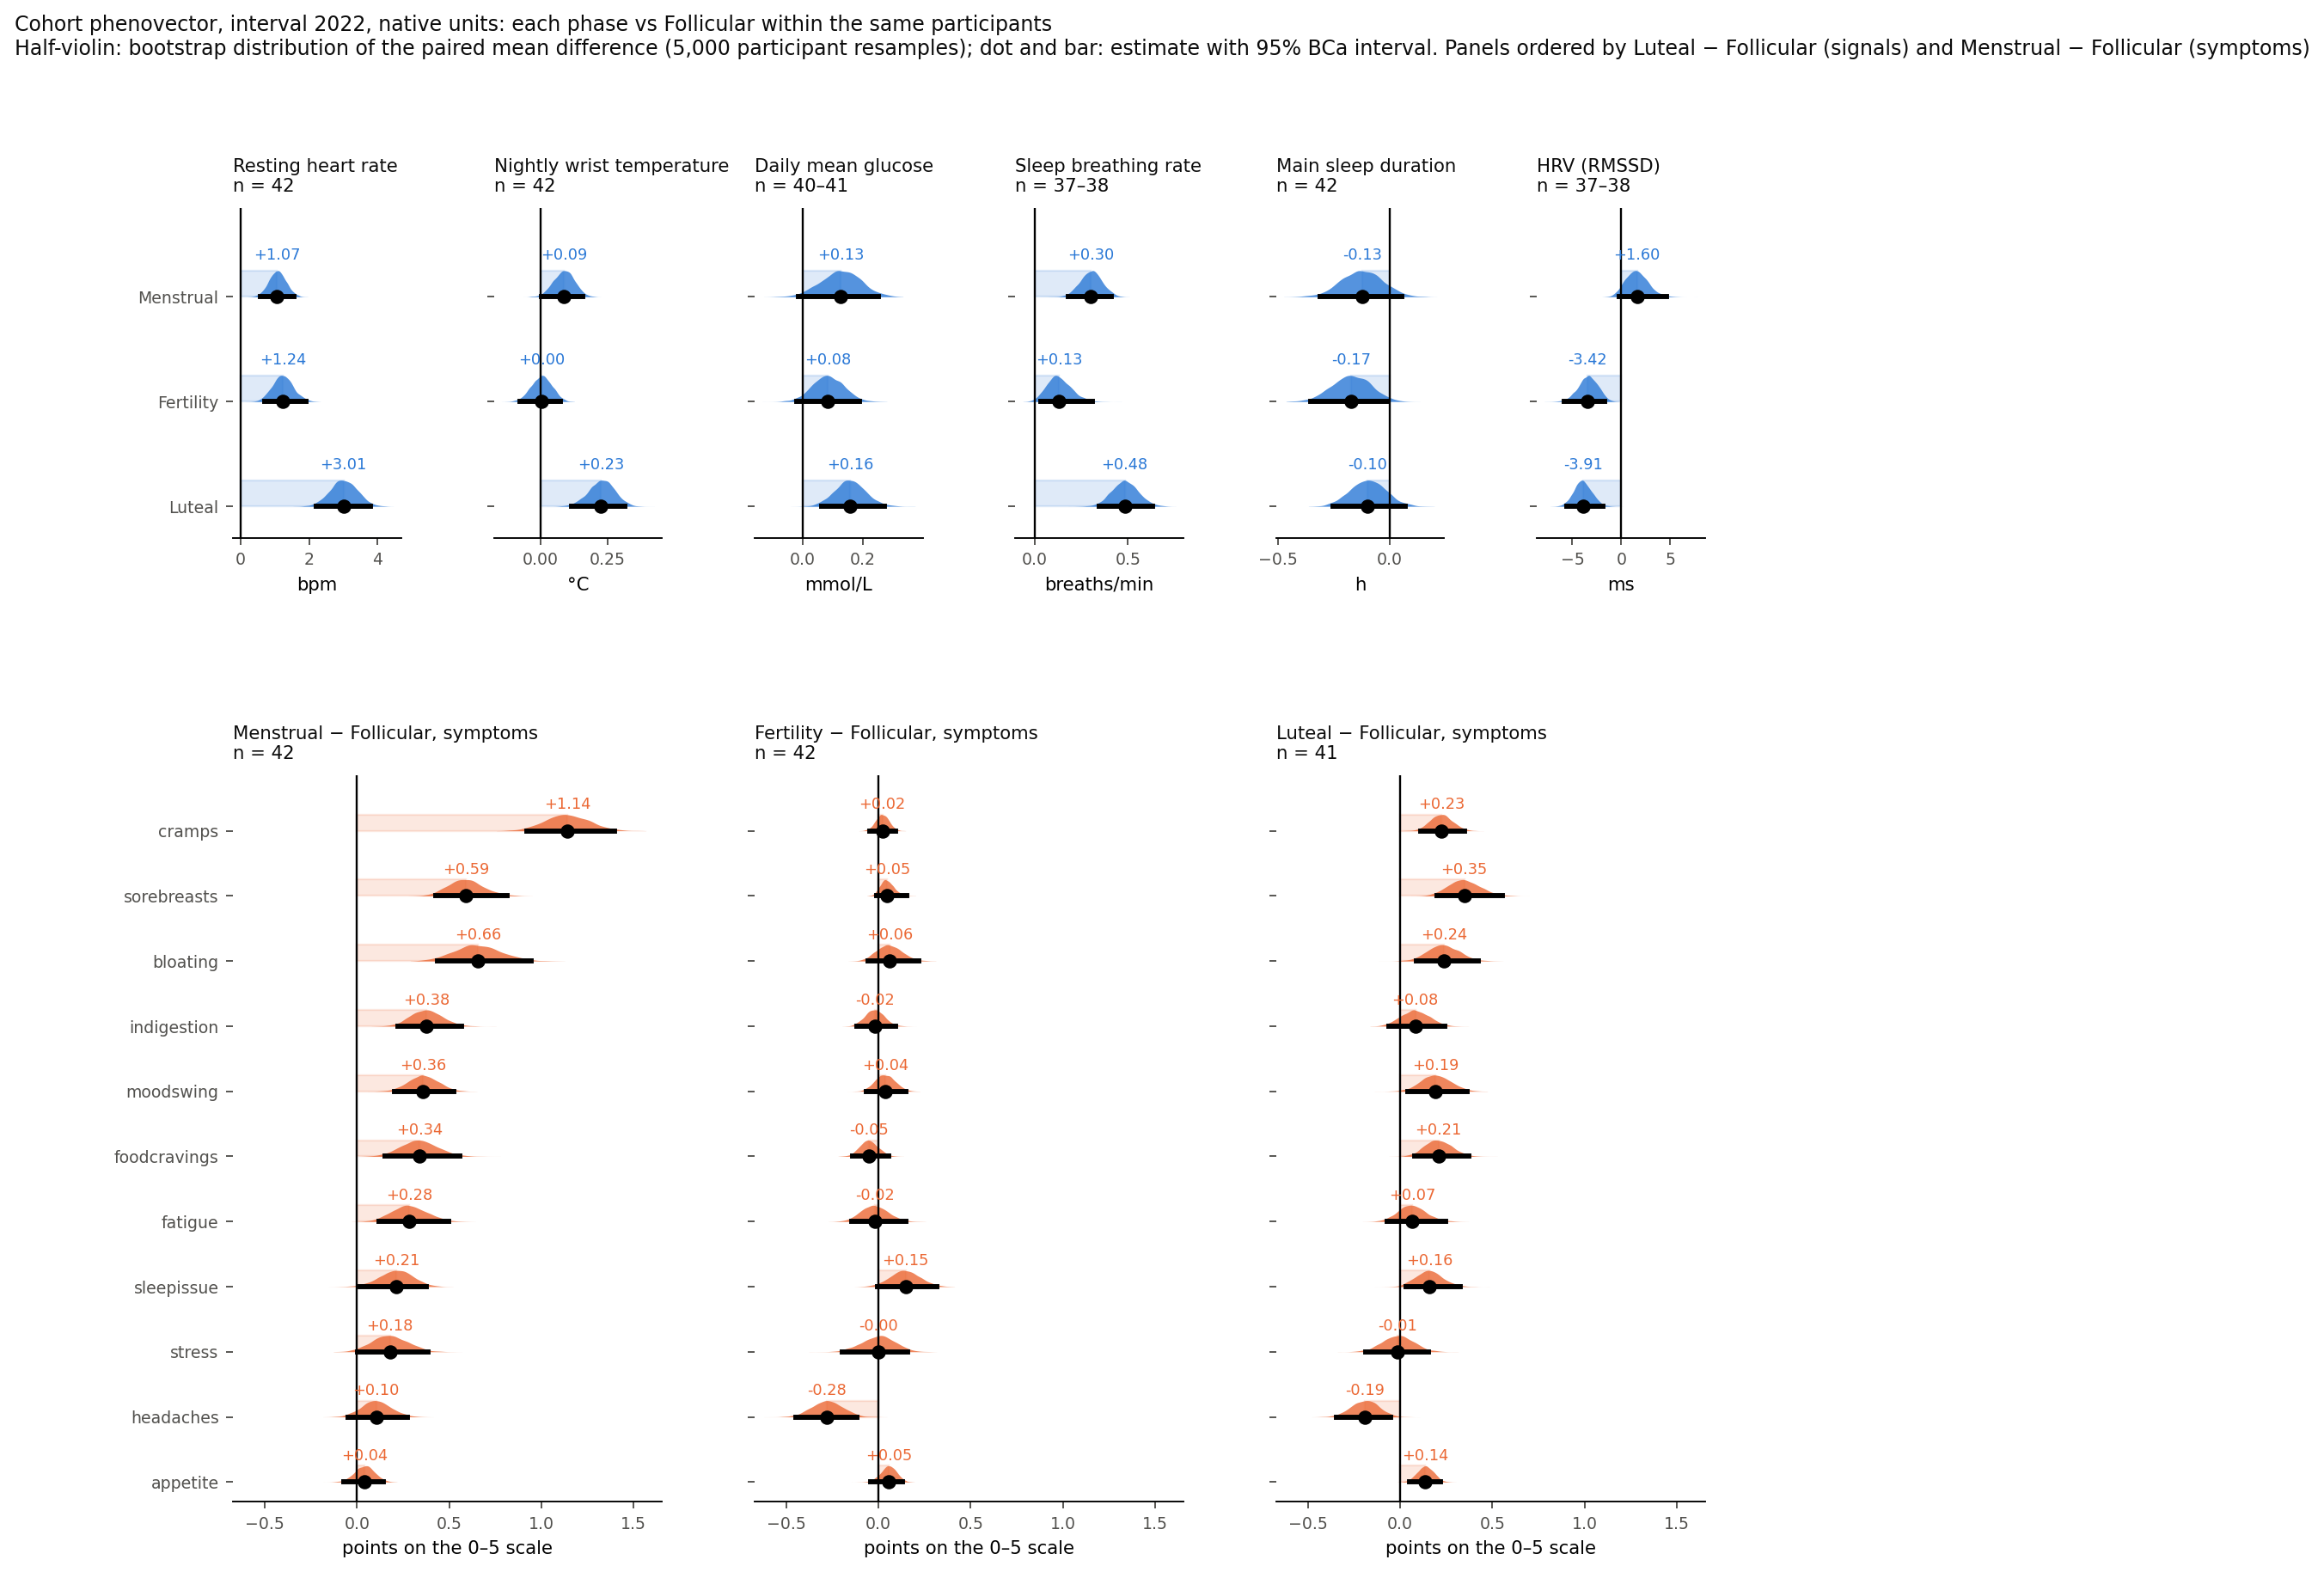
Each phase against the follicular phase, within the same participants. Interval 2022, 37–42 participants per cell.
Positive means higher than on the participant’s own follicular days. Paired mean differences with 95 % bias-corrected bootstrap intervals over 5,000 participant resamples (methods). In the same participants the luteal phase moves five of the six device metrics (sleep duration does not change); menses moves the symptoms. These contrasts agree in direction with published wearable studies (Shilaih et al. 2017; Goodale et al. 2019; Schmalenberger et al. 2019); what is new here is their size, in native units with intervals, for this dataset.
Device metrics
| Metric | n | Menstrual − Follicular | Fertility − Follicular | Luteal − Follicular | Higher in luteal |
|---|---|---|---|---|---|
| Resting heart rate (bpm) | 42 | +1.07 [0.57, 1.57] | +1.24 [0.70, 1.91] | +3.01 [2.22, 3.79] | 37 of 42 |
| Nightly wrist temperature (°C) | 42 | +0.09 [0.00, 0.16] | +0.00 [−0.08, 0.07] | +0.23 [0.12, 0.31] | 35 of 42 |
| Daily mean glucose (mmol/L) | 40–41 | +0.13 [−0.02, 0.25] | +0.08 [−0.02, 0.19] | +0.16 [0.06, 0.27] | 28 of 40 |
| Sleep breathing rate (/min) | 37–38 | +0.30 [0.18, 0.41] | +0.13 [0.03, 0.31] | +0.48 [0.35, 0.63] | 33 of 37 |
| HRV, RMSSD (ms) | 37–38 | +1.6 [−0.2, 4.6] | −3.4 [−5.8, −1.7] | −3.9 [−5.6, −1.9] | 7 of 37 |
| Main sleep duration (h) | 42 | −0.13 [−0.31, 0.05] | −0.17 [−0.35, −0.01] | −0.10 [−0.25, 0.07] | 15 of 42 |
Symptoms, points on the 0–5 scale
| Symptom | Menstrual − Follicular | Fertility − Follicular | Luteal − Follicular |
|---|---|---|---|
| cramps | +1.14 [0.92, 1.40], 41 of 42 higher | +0.02 | +0.23 [0.11, 0.35] |
| sore breasts | +0.59 [0.43, 0.81] | +0.05 | +0.35 [0.20, 0.55] |
| bloating | +0.66 [0.44, 0.94] | +0.06 | +0.24 [0.09, 0.42] |
| indigestion | +0.38 [0.22, 0.57] | −0.02 | +0.08 [−0.06, 0.24] |
| mood swings | +0.36 [0.20, 0.52] | +0.04 | +0.19 [0.04, 0.36] |
| food cravings | +0.34 [0.15, 0.56] | −0.05 | +0.21 [0.08, 0.37] |
| fatigue | +0.28 [0.12, 0.50] | −0.02 | +0.07 [−0.07, 0.25] |
| sleep issues | +0.21 [0.02, 0.38] | +0.15 [−0.01, 0.32] | +0.16 [0.03, 0.32] |
| stress | +0.18 [0.00, 0.39] | −0.00 | −0.01 |
| headaches | +0.10 [−0.05, 0.28] | −0.28 [−0.45, −0.12] | −0.19 [−0.35, −0.05] |
| appetite | +0.04 | +0.05 | +0.14 [0.05, 0.22] |
Standardized, to compare across metrics
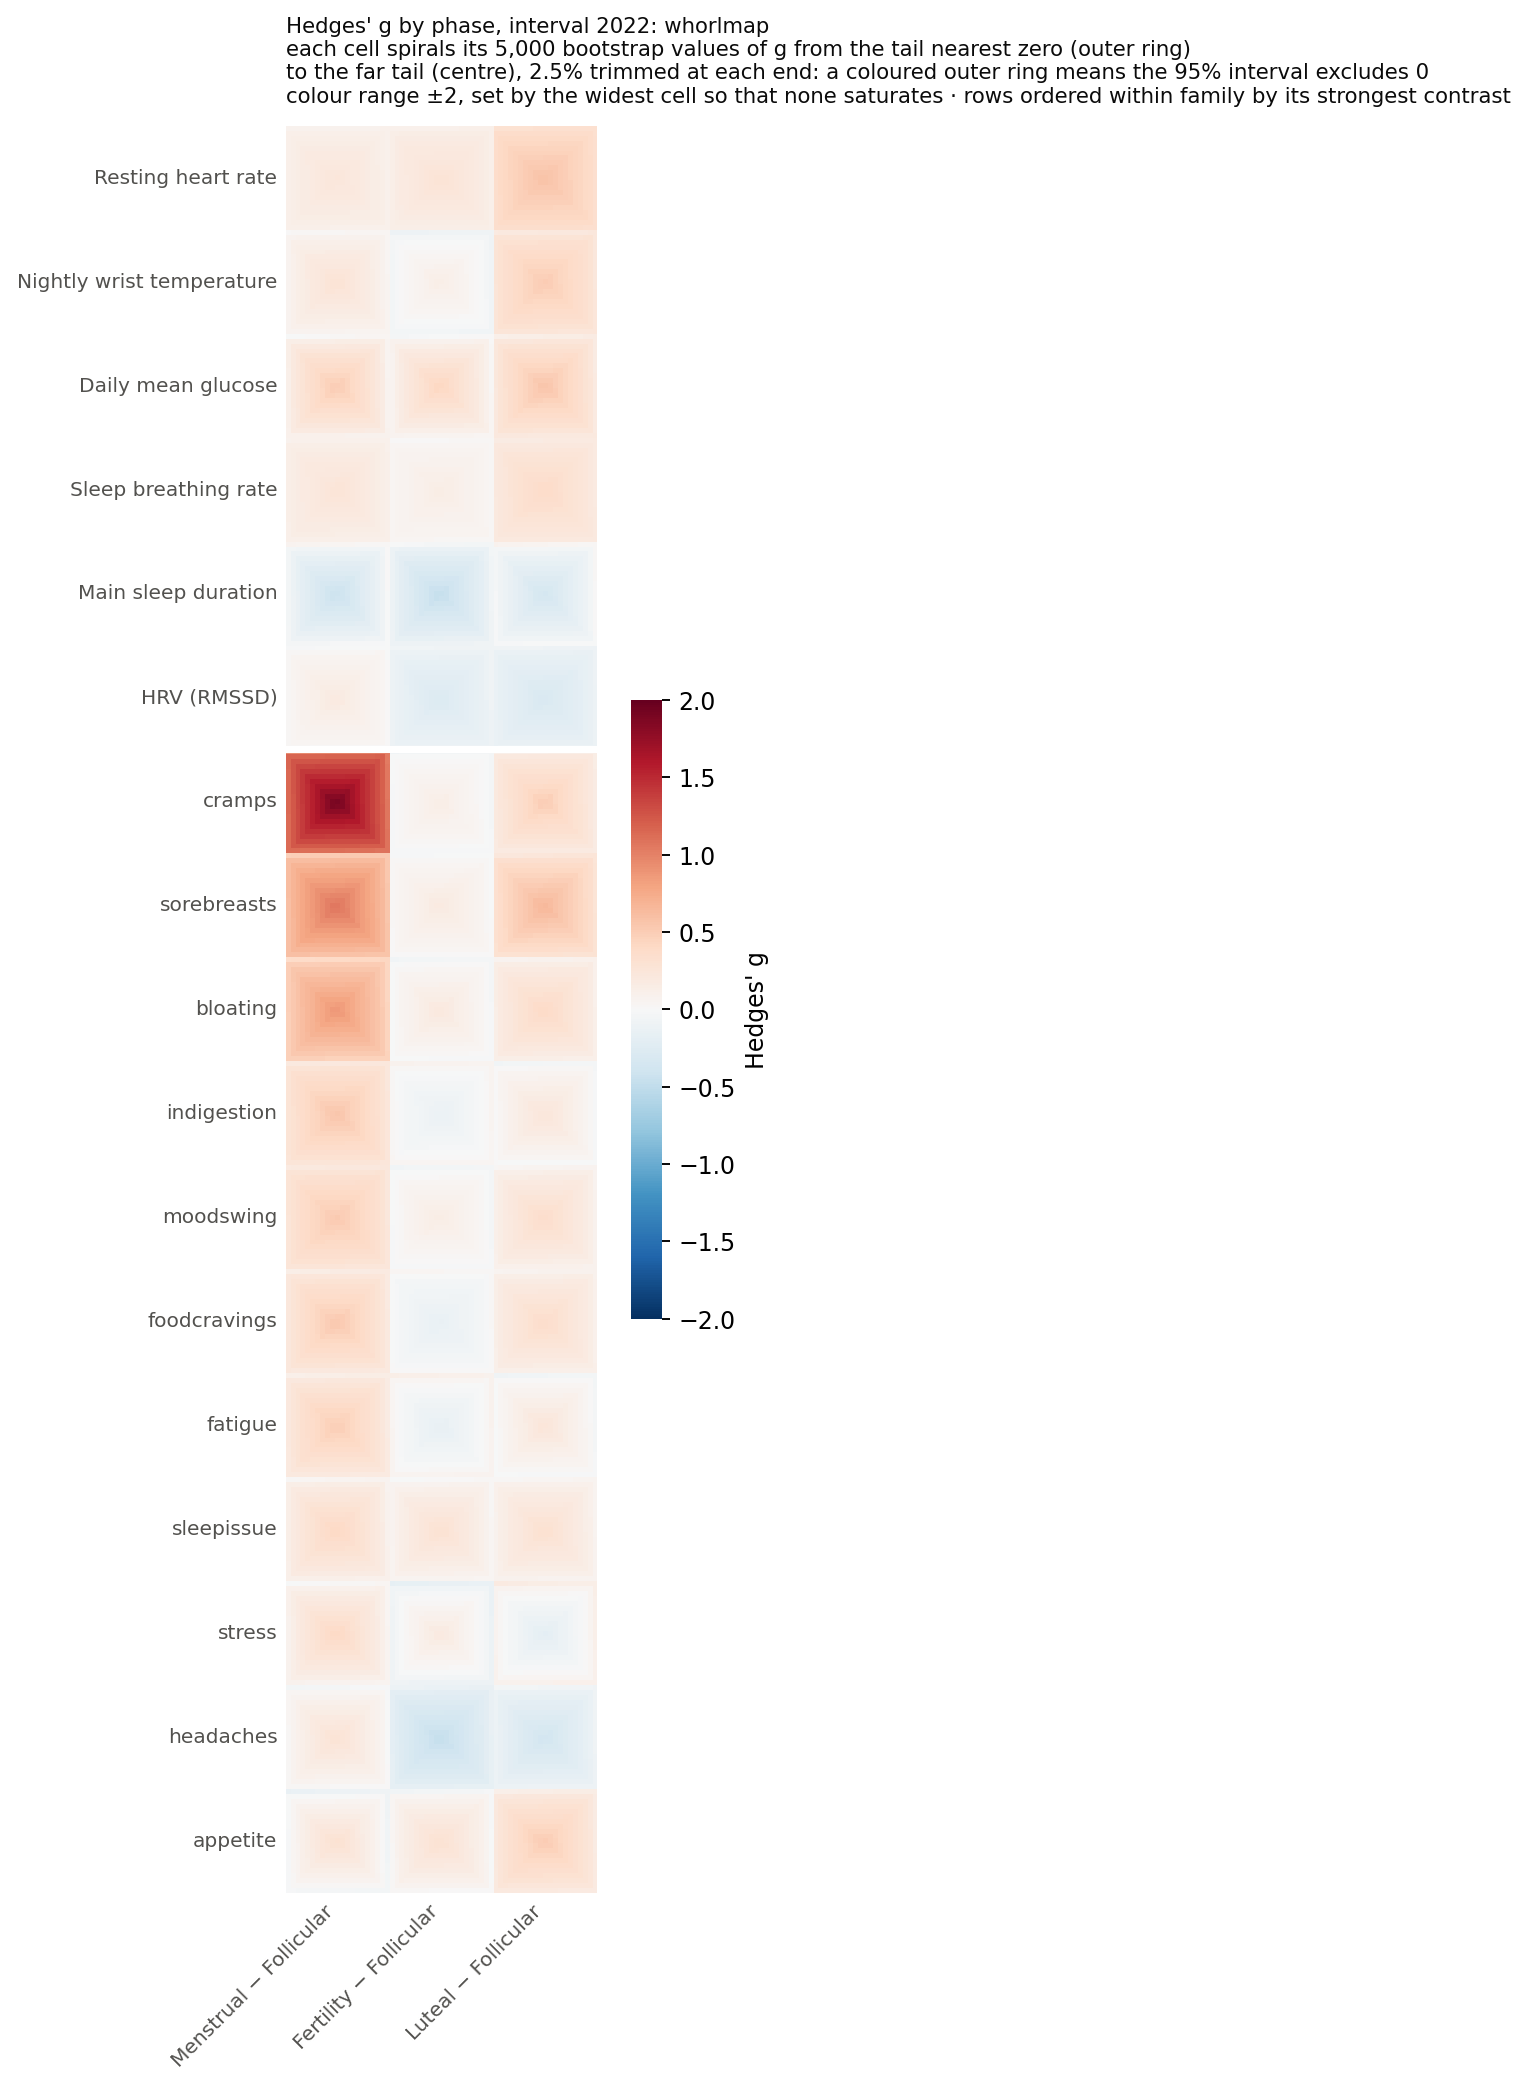
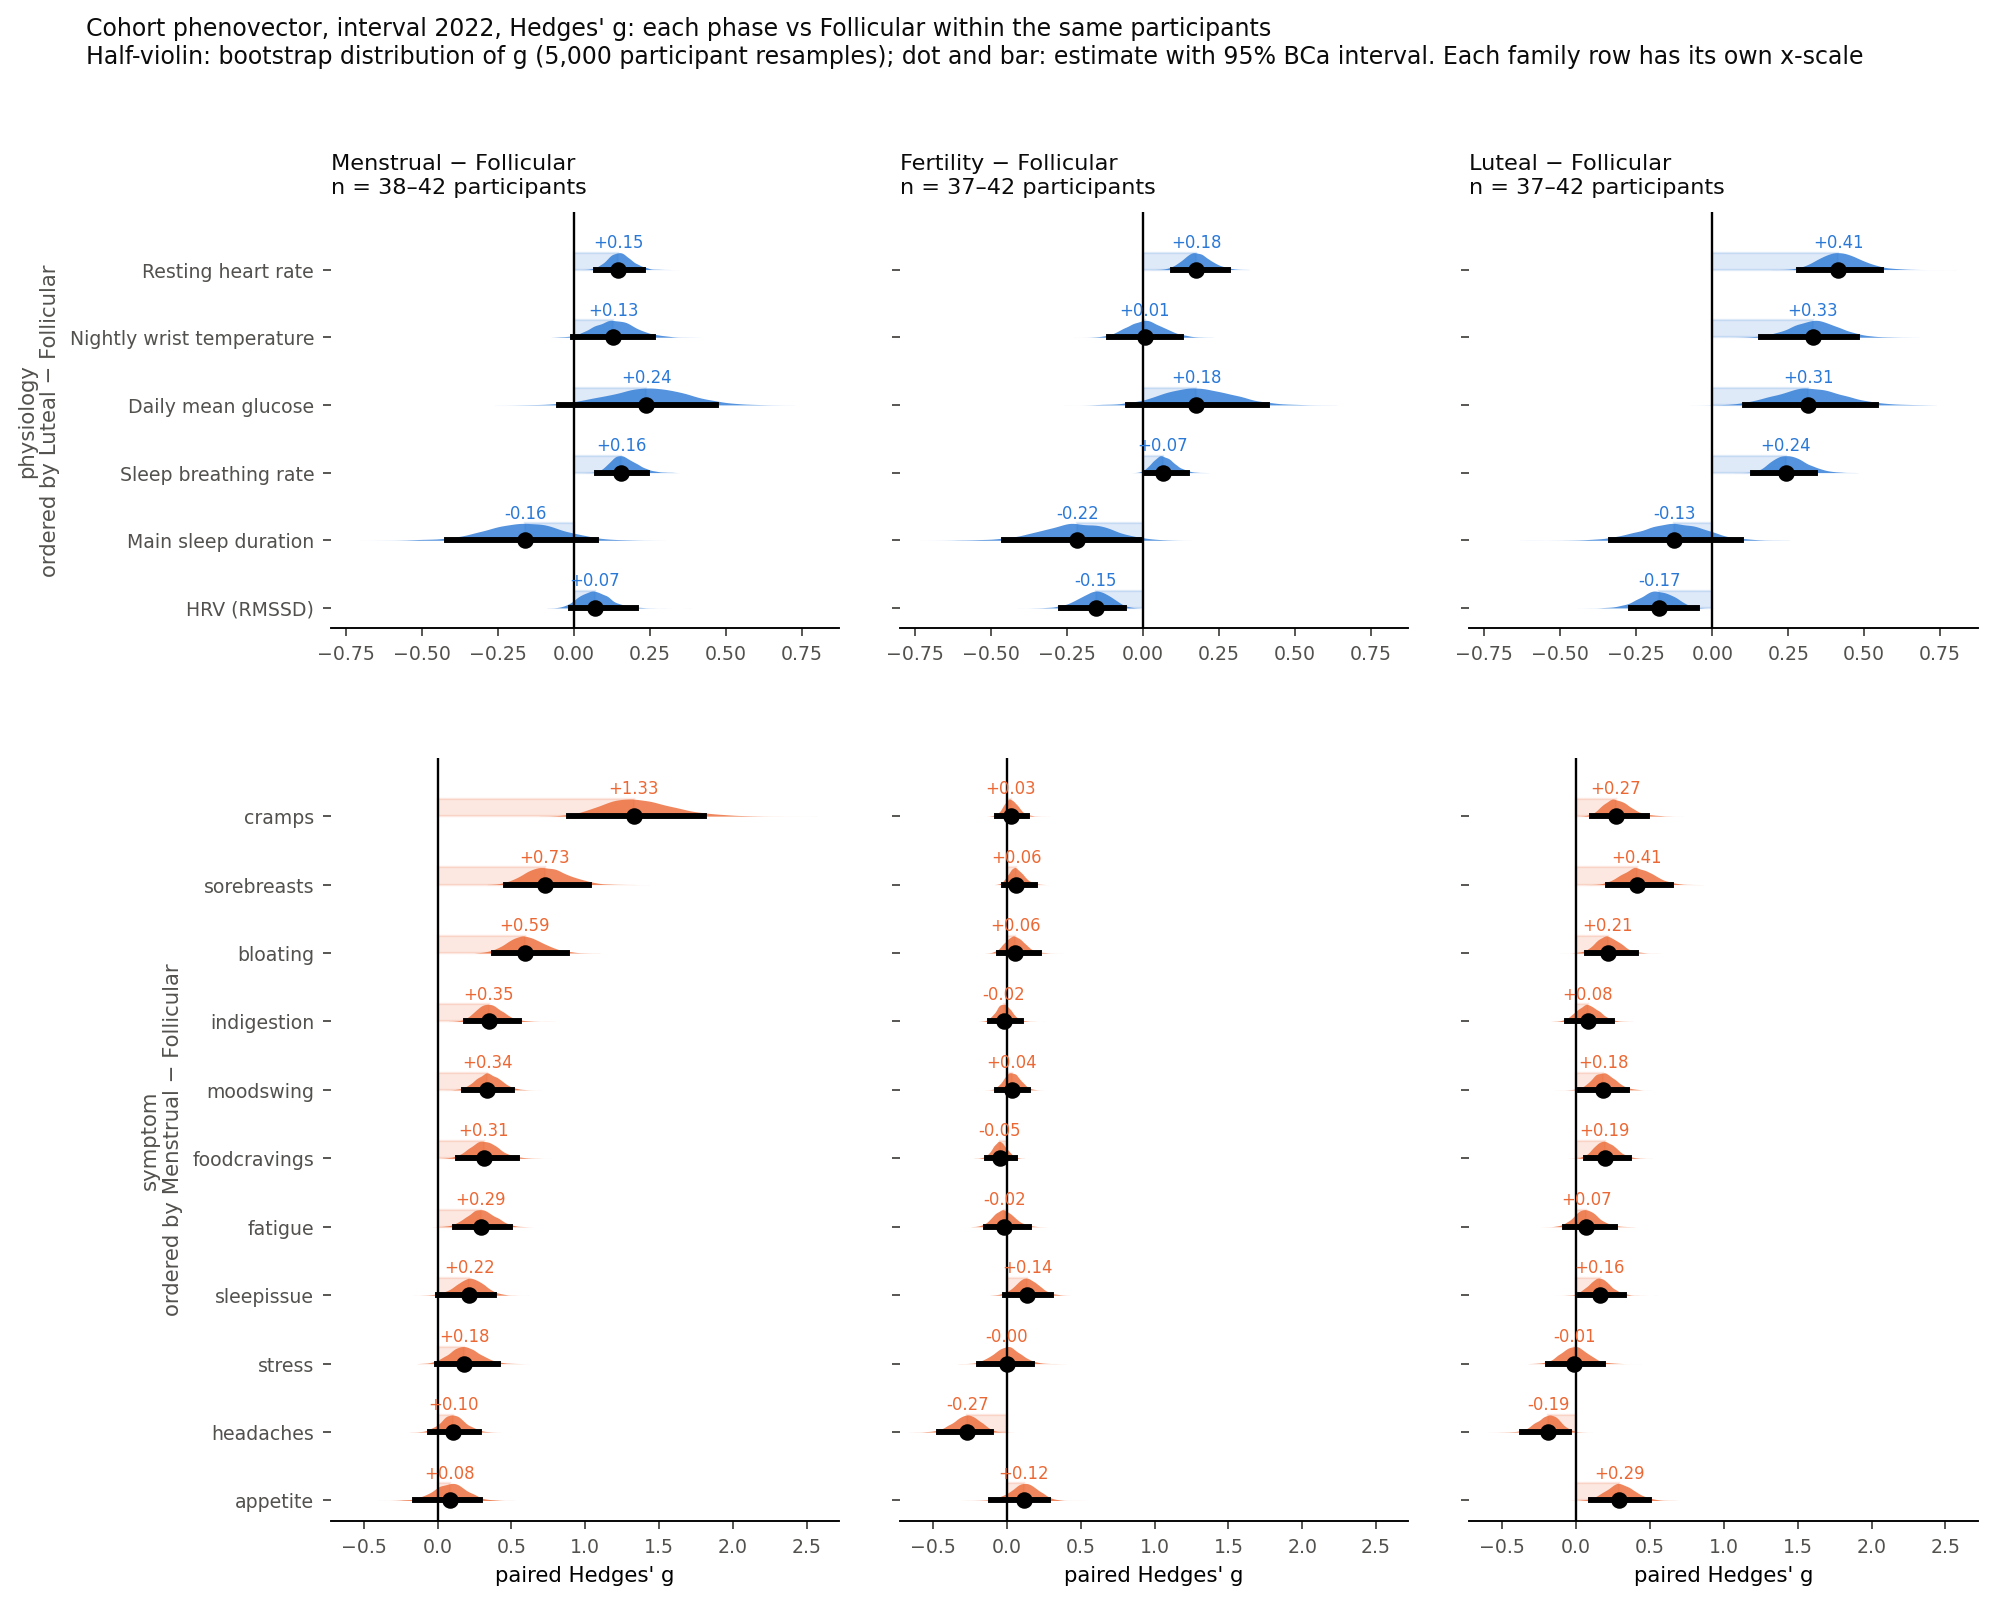
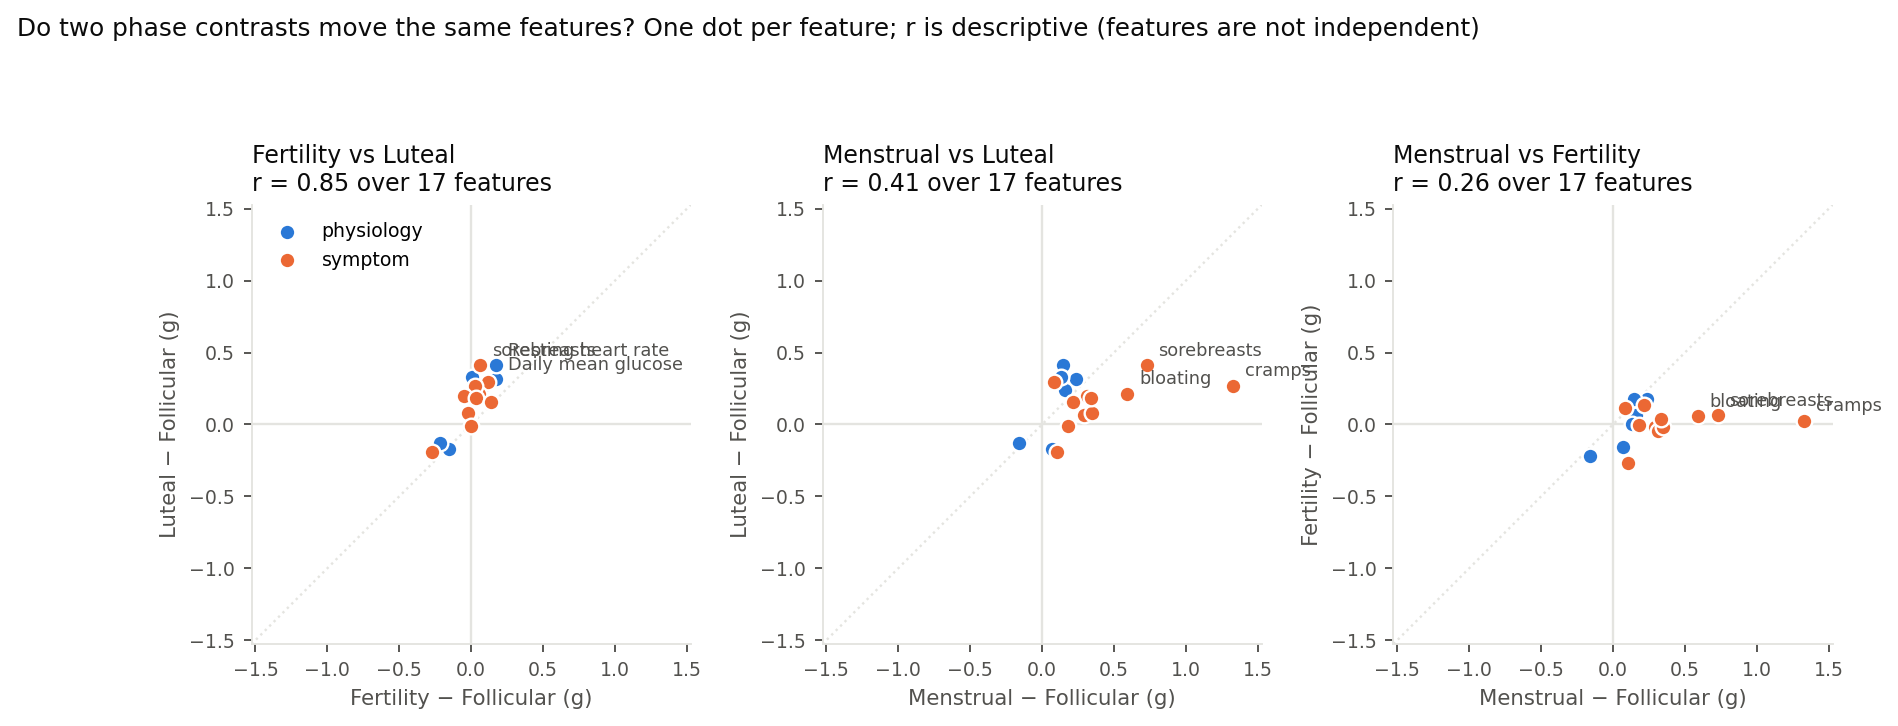
Hedges’ g uses the spread of participants’ phase means as its unit, so a consistent 3 bpm shift against baselines that differ by 7 bpm between people scores lower than a one-point symptom shift against baselines that differ by less than a point. Use it to compare cells, not to size an effect.
Read with
- Reference phase. The app’s “Follicular” label is the late-follicular phase, from the last day of flow to the first day of the fertile window, the same definition the dataset’s papers use. In this release it is short (median 6 labelled days, against 7.7–11 days in the papers), and the cohort and estimators differ, so agreement with the papers is same-direction, not replication.
- Open cycles included. Days in cycles that never closed count towards their labelled phase. Restricted to closed cycles, the luteal contrasts agree for resting heart rate (+3.0 bpm), temperature (+0.28 °C), glucose (+0.21 mmol/L) and breathing rate (+0.53 /min); HRV is smaller there (−2.5 ms against −3.9), so its size depends on that choice.
- Multiplicity. 51 cells, no adjustment. 30 exclude zero; two or three would by chance. Symptom cells are strongly correlated with each other.
- Not blind. Participants saw the app’s phase predictions while reporting symptoms.
- Data handling. 782 of 3,698 resting-heart-rate days were coded 0 and treated as missing; two participants’ glucose was converted from mg/dL; 16 of 3,258 temperature nights were dropped as artefacts.
Table: tables/cohort_phenovector.csv, 51 rows, no identifiers.